Toolkit · Problem Atlas
Problem Atlas Template
A problem-driven roadmap tool for founders, PMs, and teams who want to prioritize based on evidence, pain, and value—not just feature requests.
- Map problems, not features, across your product.
- Track evidence level, pain, reach, and business value in one place.
- Make trade-offs visible instead of implicit.
- Turn your roadmap into a problem-first conversation.
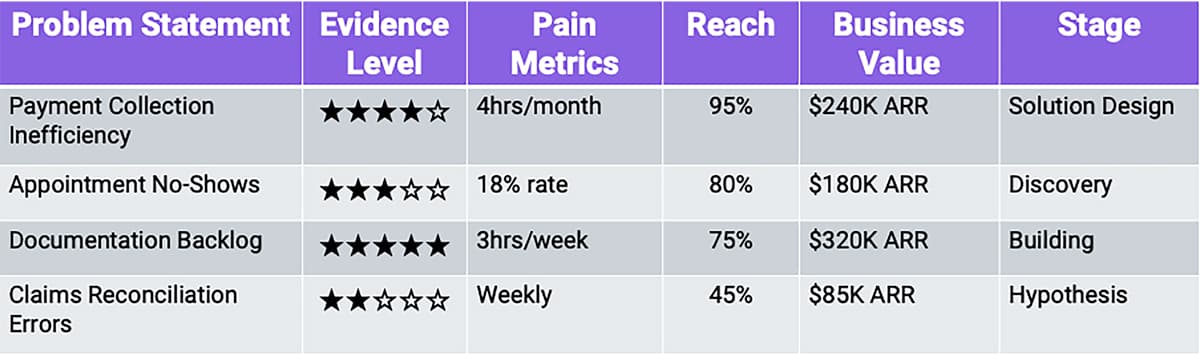
An example Problem Atlas. Each card is a problem, not a feature.
How the Problem Atlas works
Below is the Problem Atlas Template. For each problem, you document six things: problem statement, evidence level, pain metrics, reach, business value, and stage. The template is designed to be copied, adapted, and made your own.
1. Problem Statement (Clear, Solution-Free)
Write what hurts, not what fixes it.
- Not: “Customers need SMS.”
- But:“Practices lose 18% of appointments to no-shows, costing $2,400/month in lost revenue, primarily due to lack of confirmation visibility.”
Test: read it aloud without naming any technology or feature. If you can't, it's a solution in disguise. This is harder than it sounds. We're trained to jump to answers. Resist.
2. Evidence Level (How Validated Is This?)
- ★☆☆☆☆ Hypothesis — we think this hurts.
- ★★☆☆☆ Initial Signal — a few customers mentioned it.
- ★★★☆☆ Validated — interviews confirm, pattern clear.
- ★★★★☆ Deep — observed in action, quantified impact, workarounds documented.
- ★★★★★ Rooted — root causes understood, edge cases mapped, ready to design solution with high confidence.
Why this matters: investors and stakeholders can see you're not guessing; you're progressing through stages of certainty. Most teams call something “validated” when one customer complained once. This forces honesty.
3. Pain Metrics (How Much Does It Hurt?)
Three numbers tell the story:
- Frequency: how often does this bite? Daily? Monthly? Only at scale?
- Severity: how much does it cost when it happens? Time, money, stress. Get specific.
- Workaround Cost: what do customers spend today trying to cope?
Example (hypothetical):
- • Frequency: every month-end close
- • Severity: 90 minutes of manual processing
- • Workaround: staff stay late, practice pays overtime ($240/month)
The workaround cost is the hidden one. When customers are already spending to solve it themselves, you know it's real.
4. Reach (Who Feels This?)
- • % of all customers
- • % of ICP specifically
- • Which segments are most affected
Some problems affect everyone shallowly. Some affect your ideal customers deeply. The latter are worth more.
It's easy to spend months on a problem that touches 80% of users but barely bothers them, while a problem affecting 12% of your ICP is costing them hours every week. The Atlas helps you see that.
5. Business Value (What's It Worth?)
Not “this would be cool.” Be specific:
- • Revenue at risk: how much ARR is threatened if unsolved?
- • Revenue unlocked: how much expansion or new sales does solving enable?
- • Cost avoided: support tickets, churn, manual workarounds.
- • Strategic value: does solving this unlock other problems, create a moat, or enable new segments?
Example (hypothetical):
- • Retention risk: $[AMOUNT] ARR ([NUMBER] customers considering churn).
- • New sales: $[AMOUNT] pipeline blocked by this.
- • Support cost: [NUMBER] hours/month of tickets.
- • Strategic: unlocks enterprise segment (required for purchase).
This is where you connect pain to revenue. Where you stop being a feature factory and start being a business.
6. Stage (Where Are We?)
- • Hypothesis — we think this is painful.
- • Discovery — interviewing customers, validating the problem.
- • Validated — confirmed this is real and worth solving.
- • Solution Design — exploring how to solve it.
- • Building — implementation in progress.
- • Validating Solution — shipped to beta, measuring impact.
- • Solved — live, adopted, metrics improved.
Key insight: Stage ≠ “Planned / In Progress / Done.” Stage = how well we understand the problem. You can be “building” and still be at “hypothesis” stage. That's how you waste months.